Condecorações / Awards
|
Counting Lattice Points with GrafEqBy Carlos César de Araújo - cca@gregosetroianos.mat.br Portuguese version (with different examples)
We will see on this page how to use GrafEq to count lattice points (i.e., points with integer coordinates) in certain subsets of
where
pairs
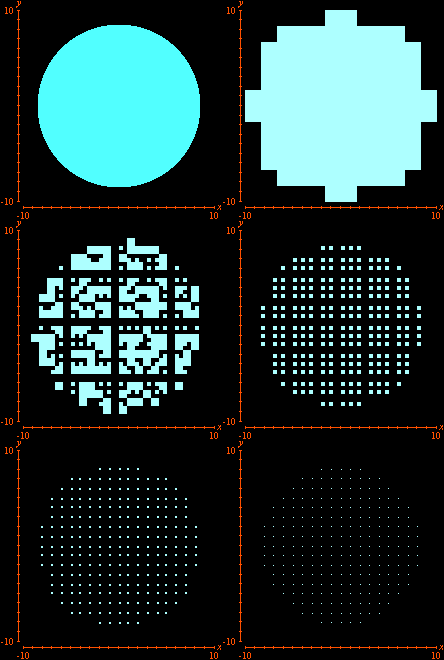
We can use GrafEq to visualize this result. All we have to do is to enter with the appropriate set of relations in the algebraic relation window. Equational conditions that characterizes the set
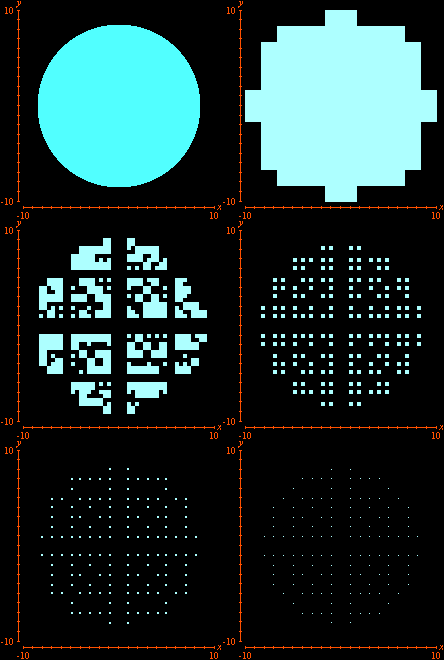
Additional constraints can also be included. Below we see the selection of points
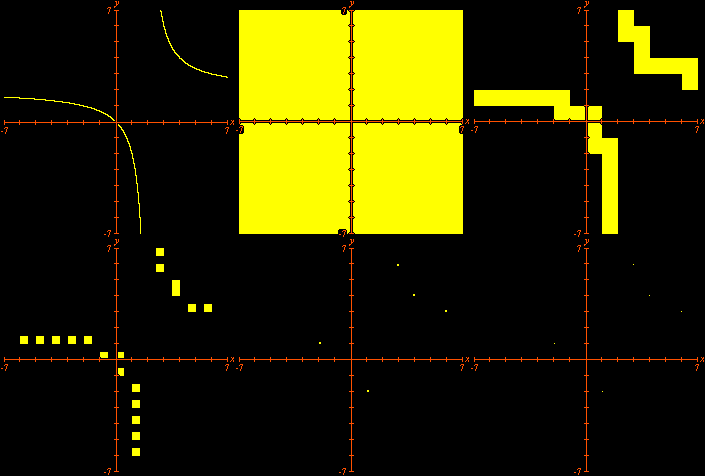
This time we are left with Looking for lattice points in curves is the subject of Diophantine equations. The next animation shows how GrafEq detects the integer solutions to the equation
The graph reveals five lattice points on the hyperbola, namely, Carlos César de Araújo, August 12, 2002 |
|
